If you took a dot and put it on the map for each person, how would that show the racial makeup of our neighborhoods?
Below, you see a map that divides the Lansing metropolitan area into census block groups, and drops a point (at random) inside that area, color-coded by how that person self-identified in the 2020 census: red for White, blue for Black or African American, green for Asian or yellow for identifies as more than one race.
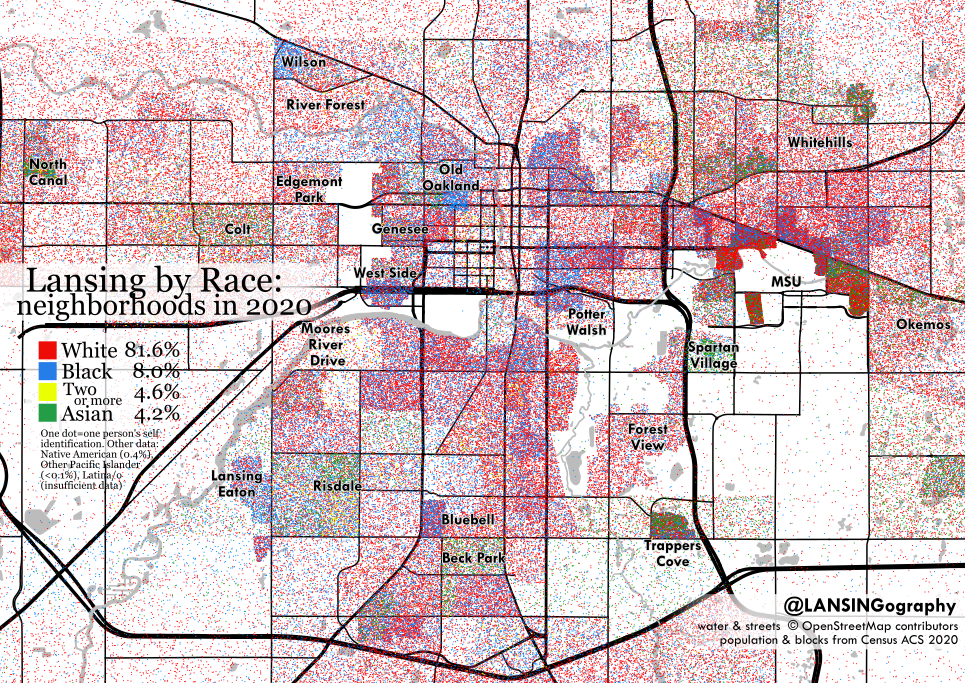
A note on missing categories: this data comes from the American Community 5-year survey. Native American/American Indian represented approximately 0.4% of Lansing over this time period. Native Hawaiian and "other Pacific islander" represented less than 0.1% in its most concentrated area. The US Census 5-year results from 2016-2020 did not count Latina/Latino in the same question as race, considering it to be an ethnicity instead, so it was not included. Starting in 2020, census questions and results leaves race more open ended and counts Hispanic or Latino as a comparable category.
What patterns do you see in this visualization? It's still possible to see the neighborhoods that were split in half by 496, which have a higher proportion of Black families: look to the West Side and the Potter-Walsh neighborhoods. There are some other enclaves and patterns as well.
Lansing: Still Segregated in the 2010s
According to a 2020 study done by the Harvard School of Public Health, Lansing ranked #2 in Michigan for integrated neighborhoods (a higher ranking meant less segregation based on race, more diverse integration), just behind Kalamazoo.
Some highly segregated locations included Cleveland, Newark, Chicago, Milwaukee, Miami and others; inside Michigan more segregated areas were Detroit, Flint, Saginaw, Muskegon, Niles, Grand Rapids and Battle Creek.
Michigan itself was still considered fairly segregated, however. Lansing was not considered as segregated as some places around the US or even around Michigan, however our score still meant that around 50% of Black/African American Lansing residents would need to move to allow the racial composition of each school to mirror the racial composition of all students in the metro area. This number was similar for Asians and Native American/American Indian people. White people tended to live in even more segregated neighborhoods: 67.5% of White families would need to more to allow their school to resemble the racial makeup of the Lansing metro area.
No comments:
Post a Comment